Observability for AI: From Tokens to Business Outcomes
Listen to this article
Preparing audio…
AI Engineering
I design AI observability to connect a user request to the exact model, context, tools, controls, cost, and outcome—without turning sensitive content into a second uncontrolled dataset.
Healthy infrastructure can hide a failing product
An AI endpoint can return HTTP 200 in two seconds while giving an unsupported answer, invoking the wrong tool, or costing three times more than the previous release. CPU, memory, error rate, and latency remain necessary, but they do not describe model behaviour.
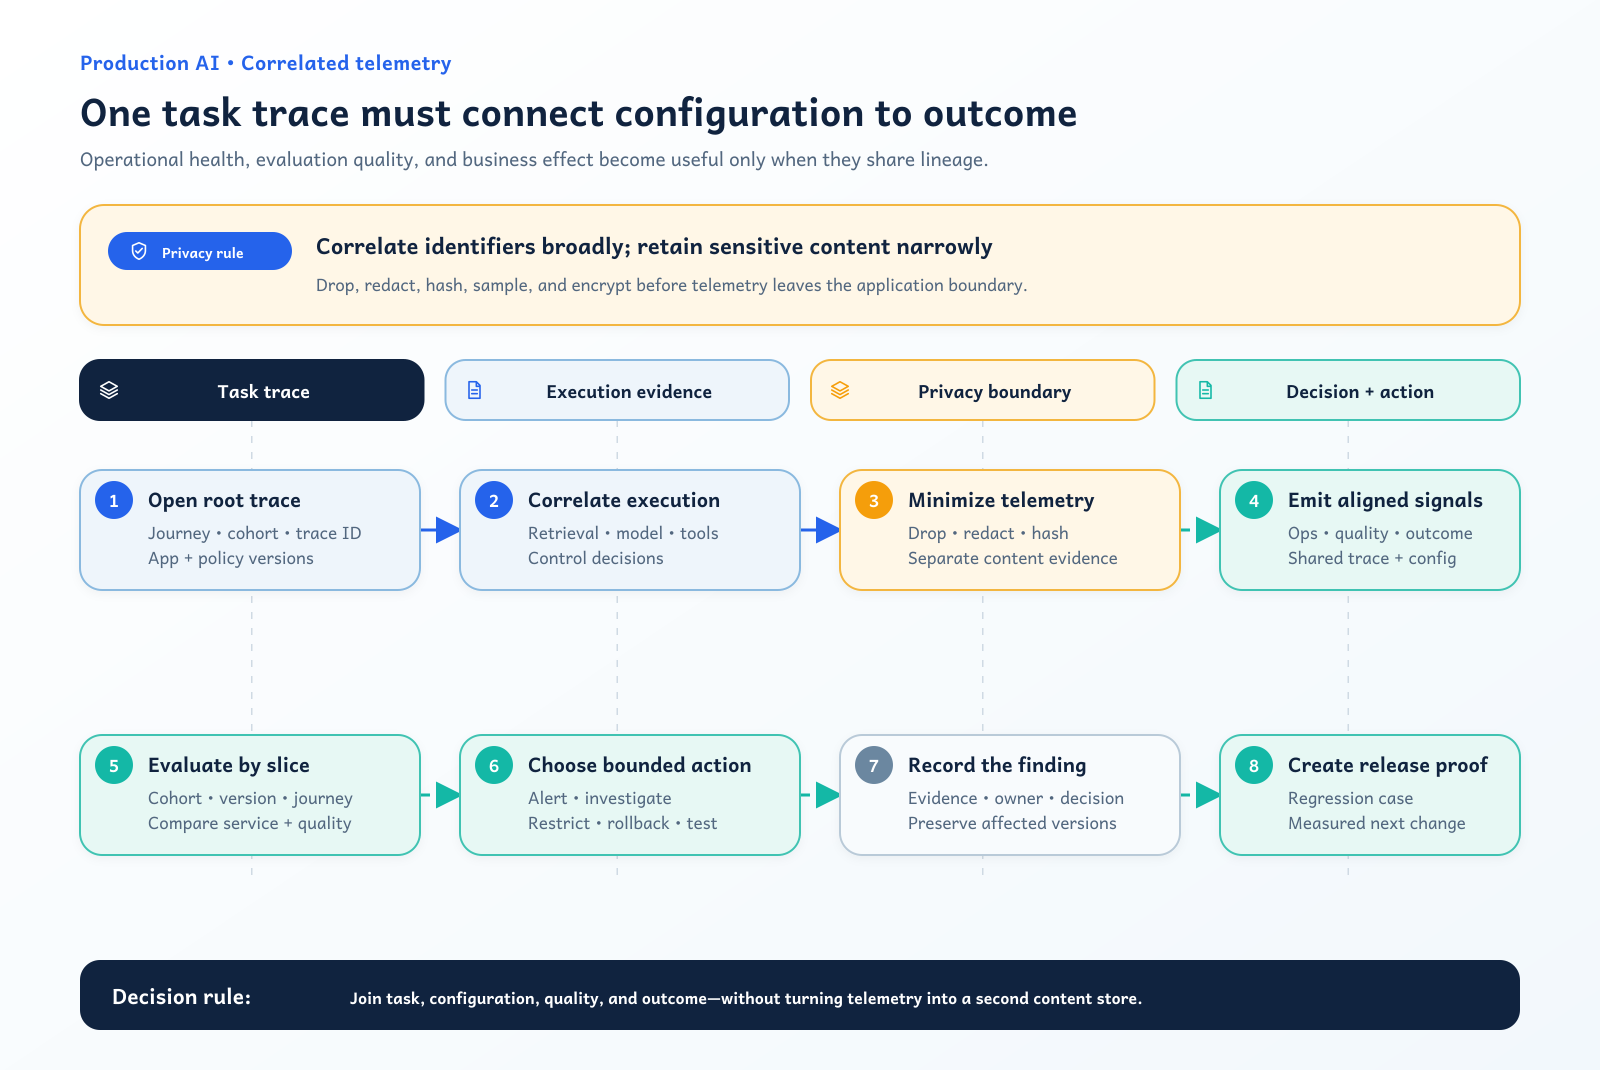
The unit of observation should be a task attempt. Give it a trace ID and capture the configuration that shaped the result: application version, prompt template, model/provider, sampling parameters, retrieval/index version, tool definitions, policy version, and experiment cohort. Then connect technical execution to evaluation and outcome signals.
OpenTelemetry semantic conventions provide a common model for traces, metrics, logs, events, and resources. When this article was researched on 19 July 2026, the page referenced semantic conventions 1.43.0 and GenAI-related attributes were still evolving. Pin the convention version; do not assume an experimental attribute will remain stable.
Design a correlation spine
I start with one root span for the application task. Child spans represent retrieval, model calls, tool execution, and policy checks. I use stable, low-cardinality names such as chat.answer or payment_policy.lookup, not the user’s question. The OpenTelemetry guidance on writing semantic conventions explicitly emphasizes low-cardinality operation naming, stability, signal design, and careful treatment of expensive or sensitive attributes.
Record references to versions rather than copying entire artifacts into every span. A prompt registry ID can resolve to the approved template; a retrieval snapshot ID can identify the indexed corpus; a tool-call span can contain the validated operation name and status. This keeps traces queryable while preserving a chain to deeper evidence under stricter access controls.
Use metrics for aggregates and service objectives: request rate, first-token and total latency, tokens, cost estimate, tool error rate, empty retrieval rate, policy blocks, and task completion. Logs should capture exceptional diagnostic events. Traces explain causality across a sampled request. Evaluation records attach quality judgments that may arrive later.
Observe quality at three timescales
Inline controls run before or during the response. Examples include schema validation, tool authorization, citation presence, secret detection, and policy filters. Their outputs should appear as named decisions with policy versions, not anonymous “guardrail failed” strings.
Nearline evaluation samples recent traces after completion. Deterministic checks and calibrated graders can assess groundedness, instruction following, or tool correctness. Sample by risk and cohort; a uniform 1% sample may miss rare high-impact workflows.
Offline evaluation uses controlled, versioned datasets before release and after incidents. It measures regressions reproducibly. Production traces can suggest new cases, but copying live personal data into a test set without consent and governance creates another privacy problem.
The NIST Generative AI Profile, published in July 2024 and updated on its page in April 2026, supports lifecycle monitoring of performance, incidents, misuse, privacy, and information-integrity risks. It does not prescribe one telemetry stack; the organization must map signals to its actual harms and controls.
Treat privacy as architecture, not redaction later
Prompts, retrieved documents, model outputs, and tool arguments may contain personal data, financial information, credentials, or proprietary material. Do not log them by default. Decide per field whether to drop, transform, hash, tokenize, sample, encrypt, or store in a restricted evidence vault with a shorter retention period.
Separate a low-sensitivity operational stream from controlled content evidence. Most dashboards need counts, durations, versions, and status—not raw conversations. If content capture is justified for incident investigation, enforce purpose limitation, role-based access, audit logs, retention/deletion, and tenant isolation. Redaction should happen before data leaves the application trust boundary; downstream cleanup is too late.
Be cautious with labels. User thumbs-up is affected by interface and expectation; escalation may be the correct outcome; a grader score may drift when its model changes. Store label source, definition, rubric, and version. Do not merge unlike signals into a single “quality” metric.
Build alerts around decisions
An alert should name a failure, affected slice, threshold, and response. Useful examples include:
- unauthorized tool attempts above zero for a privileged workflow;
- groundedness regression for one language or corpus version;
- p95 cost per completed task exceeding its release budget;
- retrieval empty-result rate rising after an index migration;
- model fallback or policy block rate changing sharply by cohort;
- user corrections increasing while infrastructure metrics remain stable.
Avoid cardinality explosions by putting user IDs, full URLs, prompts, or document IDs into metric labels. Keep those identifiers in controlled trace/event records if justified. Sample strategically: retain all severe incidents, a representative baseline, and enough cases from rare high-risk slices.
A synthetic incident walkthrough
Here is how I would investigate a synthetic incident. Consider an assistant that answers policy questions from a versioned knowledge base. After a deployment, latency and HTTP errors remain unchanged, but user corrections rise for Arabic questions.
The correlation spine shows that affected traces used prompt version 12 and index version 31. Retrieval returned relevant passages, but a nearline evaluator flags incorrect date interpretation. The release comparison isolates the regression to the new prompt, not the model or index. Traffic is routed to prompt version 11, the failing traces become de-identified regression cases, and a language-specific release threshold is added.
Without versioned prompts, retrieval evidence, outcome labels, and slice-aware evaluation, the team would see only healthy servers and anecdotal complaints.
The observability contract
For every material AI workflow, document what constitutes success, which configuration identifiers are required, which signals are collected, who may access them, how long they persist, and which threshold triggers rollback or investigation. Test trace completeness just as you test application behaviour.
My design rule is not “log everything.” I want a deliberately limited evidence system that explains how a particular configuration produced a particular outcome and whether that outcome was acceptable. The privacy boundary is part of its correctness.
Related reading
- AI Agents in Regulated FinTech: Control Before Autonomy
- RAG for Financial Operations: Evidence Over Eloquence


What decision would you make?
Add a question, a field note, or a respectful counterpoint. Comments are for signed-in members so the discussion stays useful and professional.